Essential Headless eCommerce Statistics for 2025
Psst: we are hiring remote frontend developers and backend developers.

In 2025, eCommerce revenue is expected to surpass $6.8 trillion (). And 21% of all global sales ()will be made online by an estimated 2.77 billion shoppers ().
Do you want to capture some of that business? Of course, you do! But it’s tough out there: you’re competing with over 28 million eCommerce stores ().
How do you get ahead? Simple. You go headless.
In the Crystallize post, we discussed the term extensively. In case you haven’t encountered it, the simplest definition is an eCommerce solution in which the webshop's front and back end are decoupled. The connection between the front and back end eCommerce service is an eCommerce API. Underneath, all is based on . Check both of our linked articles for more.
The surge of headless commerce is reshaping the eCommerce landscape, offering more flexibility, improved performance, and personalized customer experiences. Still, convincing everyone to switch from familiar monolithic solutions to headless architecture can be challenging.
To strengthen your pitch, we examined the current state and trends of headless adoption and compiled statistics revealing how quickly headless commerce is gaining ground. It's not cherry-picking. We’ll present the facts so you can analyze and interpret them yourself.
Ready? Let’s dive in!
[newsletter]Join Crystallize newsletter!
Shift BUSINESS perspective to headless architecture and modern web development with our newsletter.
Headless eCommerce Adoption
The eCommerce arena is already familiar with the advantages a headless platform provides over traditional monolith systems. A Censuswide survey, as reported by WP Engine, revealed the following from over 1,000 respondents:
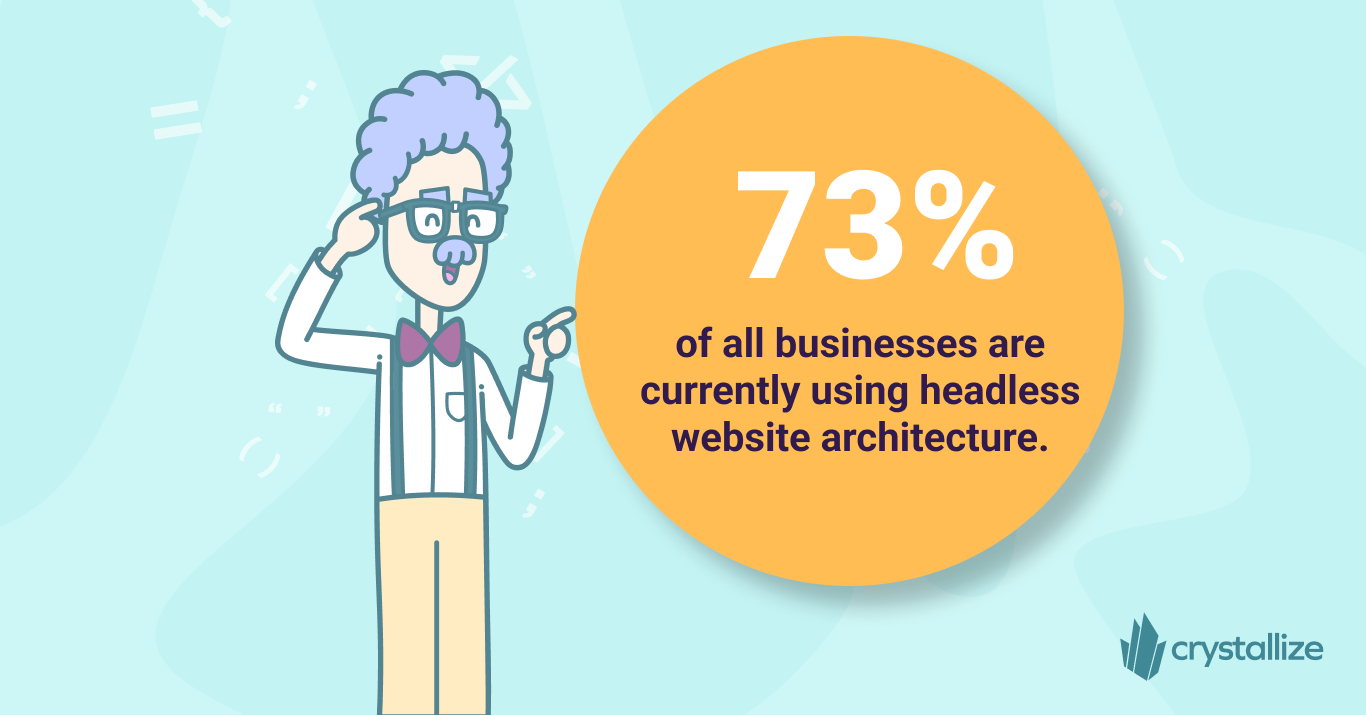
73% of all businesses are currently using headless website architecture. [1]
Among those not currently using headless, nearly 98% plan to evaluate headless solutions over the next 12 months. [1]

Over six in ten retail companies plan to migrate to headless commerce platforms by 2024, while over 20 percent already use them. [7]
CB Insights Q1 2024 Funding Analysis reports that headless commerce startups saw a 50% increase in VC investments compared to Q1 2023, signaling strong investor confidence in continued market expansion. [9]
Europe and North America hold 63% of the global market share for headless commerce solutions. [8]
Growth and Market Value
The market size was valued at $1.32 billion in 2020 and is expected to reach $13.08 billion by 2028, reflecting a remarkable CAGR of 30.1%. [2]
The Headless CMS market is expected to reach $3.8 billion by 2032. [2]

Headless eCommerce Benefits
Flexibility: Across all industries surveyed by Statista, the ability to customize digital experiences was the number one benefit of headless commerce. [5]
91% of customers are likelier to shop with brands that recognize, remember, and provide relevant offers and recommendations. [4] ( is vital!)
Speed to market: 80% of survey respondents feel their organization is ahead of competitors when delivering new digital experiences. [1]
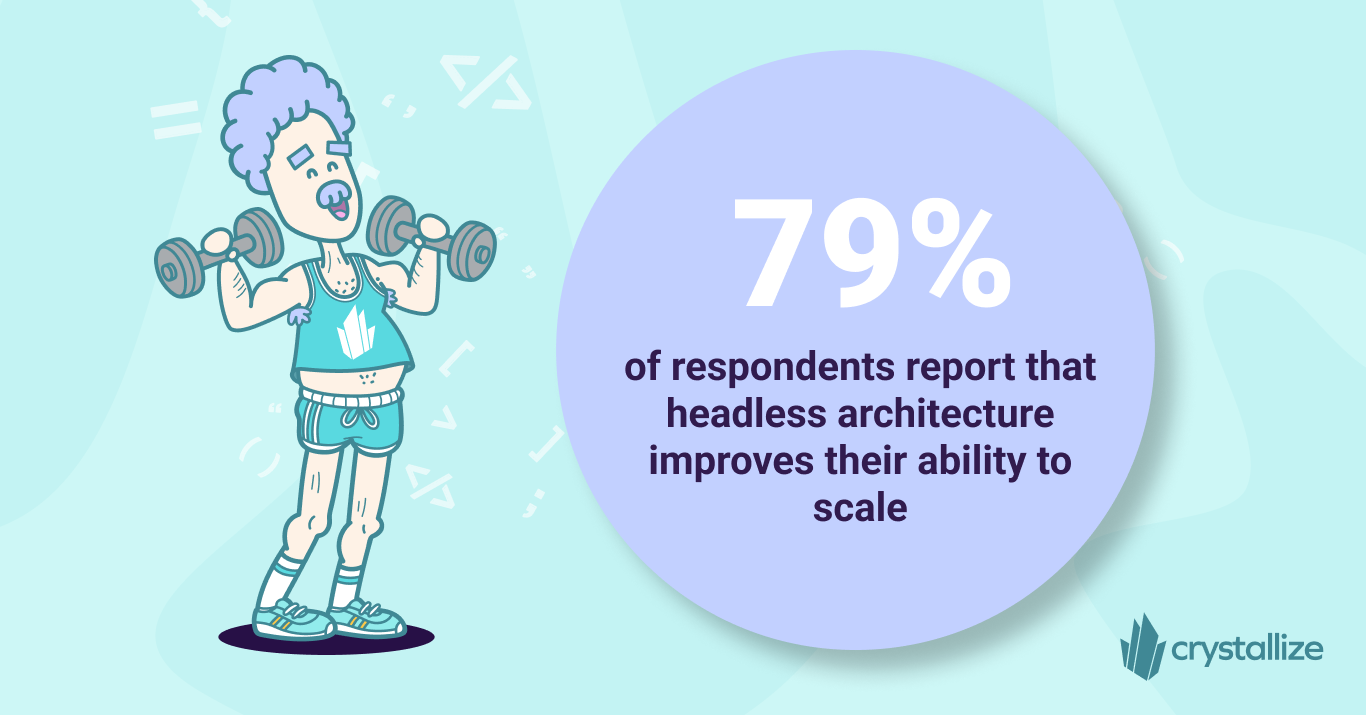
Scalability: 79% of respondents report that headless architecture improves their ability to scale. [1] With new customers and new technologies coming online every day, meeting your customers where they are and keeping up with the growth of the business are vital to sustained success.

Improved frontend performance: The decoupled headless architecture, requiring fewer server requests, often improves performance. A recent study found that 57% of customers abandon a website if a page takes longer than 3 seconds to load. [6]
Supporting an omnichannel presence: 82% of respondents say headless architecture makes delivering a consistent content experience easier. [1]
Businesses with omnichannel customer engagement strategies retain, on average, 89% of their customers. [4]
Moving Forward
It should be clear by now that headless architecture is no longer an option. Within a few short years of its introduction, it has become the way forward for savvy businesses who want to delight their customers and keep pace with a rapidly changing future.
If you haven’t adopted a headless approach yet, there’s no time like the present!
is ready and waiting to serve as your backend for any number of frontends (e.g., web, mobile, kiosk).
Sources we used the following sources:
[] https://wpengine.com/wp-content/uploads/2024/09/WPE-EBK-State-of-Headless-2024.pdf
[] https://www.grandviewresearch.com/sector-report/e-commerce-industry-data-book
[] https://blog.webnexs.com/headless-commerce-statistics-market-size-overview/
[] https://gitnux.org/e-commerce-data/
[] https://www.statista.com/statistics/1364506/headless-commerce-benefits-industry/
[] https://red-website-design.co.uk/why-you-are-losing-57-of-your-website-visitors-within-3-seconds/
[] https://www.statista.com/topics/11079/e-commerce-platform-technologies/#topicOverview
[] https://themeisle.com/blog/cms-market-share/
[] https://www.cbinsights.com/research/report/venture-trends-q1-2024/